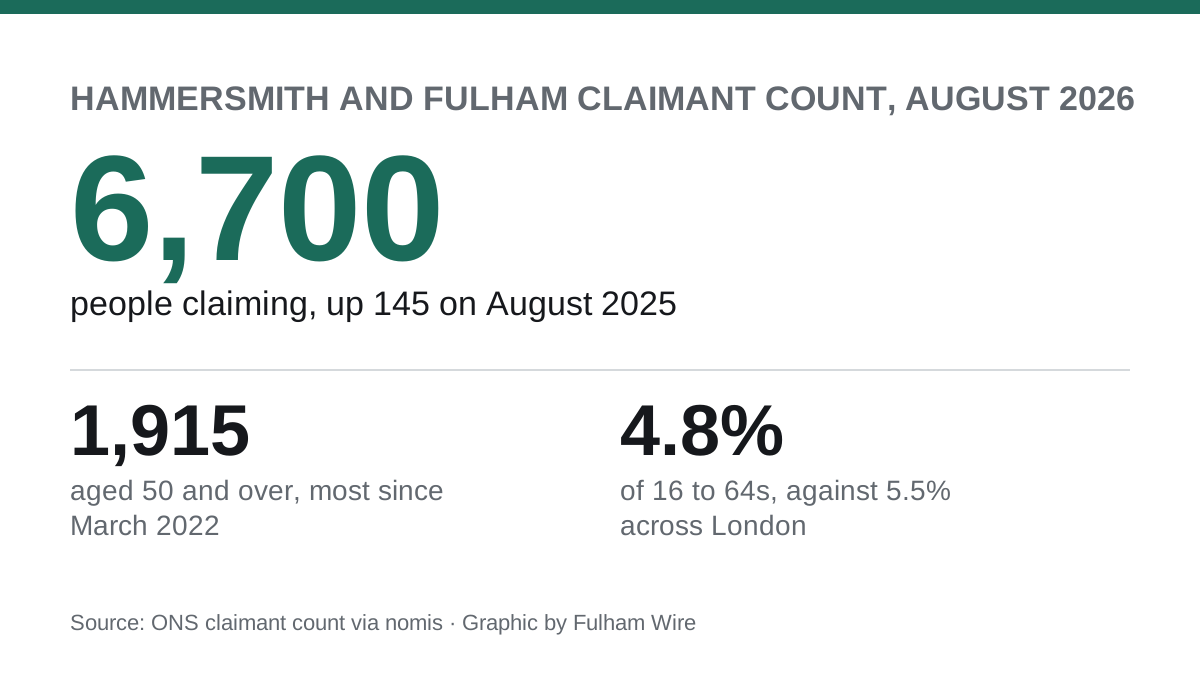

6,700 people claimed in August, up 145 on a year while London fell. Over-50s reached 1,915, the most since March 2022, and 60 to 64s drove the rise.
There were 6,700 people claiming out-of-work benefits in Hammersmith and Fulham in August. That is 145 more than in August 2025, a rise of 2.2 per cent.
London moved the other way. The capital’s count fell by 1.0 per cent over the same year.
Most of the borough’s rise came from older residents. Claimants aged 50 and over reached 1,915, the highest in any month since March 2022.
The figures come from the ONS claimant count, published through nomis. August’s numbers were released on 15 September 2026 in the ONS labour market overview.
July has been revised down
The ONS has revised July’s figure for the borough from 6,700 to 6,555. We reported the original figure in August, and that story now carries an update note.
On the revised numbers, the count rose by 145 between July and August. The count has now been between 6,400 and 6,800 in every month since the start of 2025.
The rise is concentrated in the early 60s
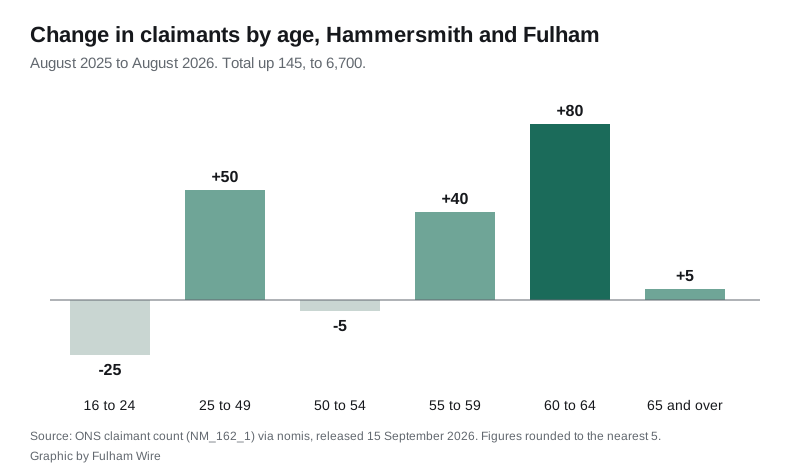
Across the year to August 2026, the age groups moved like this:
| Age group | August 2025 | August 2026 | Change |
|---|---|---|---|
| 16 to 24 | 880 | 855 | down 25 |
| 25 to 49 | 3,885 | 3,935 | up 50 |
| 50 to 54 | 625 | 620 | down 5 |
| 55 to 59 | 570 | 610 | up 40 |
| 60 to 64 | 455 | 535 | up 80 |
| 65 and over | 140 | 145 | up 5 |
The 60 to 64 group rose by 80, or 17.6 per cent. On its own it accounts for more than half of the borough’s rise. At 535 it is the highest since February 2022.
Taken together, the over-50s rose by 120 in the year, from 1,795 to 1,915. Under-25s were the only broad age group to fall.
Men and women rose by similar amounts. There were 3,640 male claimants, up 80, and 3,065 female, up 70. ONS rounds every figure to the nearest five, so the parts do not always add to the total.
Where the borough sits in London
The claimant count is also published as a rate. In Hammersmith and Fulham it was 4.8 per cent of residents aged 16 to 64 in August, up from 4.7 per cent a year earlier.
That is below London’s 5.5 per cent, which fell from 5.6 per cent. It is above the UK rate of 3.9 per cent, which rose from 3.8 per cent.
Twelve of London’s 33 local authorities have a lower rate than Hammersmith and Fulham. Harrow is level with it on 4.8 per cent. The neighbours split clearly:
| Borough | Claimant rate, August 2026 |
|---|---|
| Brent | 7.2% |
| Ealing | 6.4% |
| Hounslow | 5.0% |
| Hammersmith and Fulham | 4.8% |
| Wandsworth | 4.0% |
| Westminster | 4.0% |
| Kensington and Chelsea | 3.4% |
The highest rates in London were in Barking and Dagenham, Haringey and Newham, all on 7.4 per cent. The lowest, outside the City of London, was Richmond upon Thames on 2.6 per cent.
What the claimant count actually counts
The claimant count is not the unemployment rate. It counts people claiming Jobseeker’s Allowance, plus Universal Credit claimants who are required to look for work. Since Universal Credit, that includes some people who are in work but on low earnings.
The ONS labels the local authority figures “official statistics in development”, and the latest month can be revised, as July’s was.
What it means for you
- If you want to retrain, the council’s adult learning and skills service says it runs more than 450 part-time courses at venues across the borough.
- The next figures, for September, are due on Tuesday 20 October 2026.
- House prices, council tax and other borough figures are collected on our Fulham house prices and Fulham council tax bands pages.
Have your say