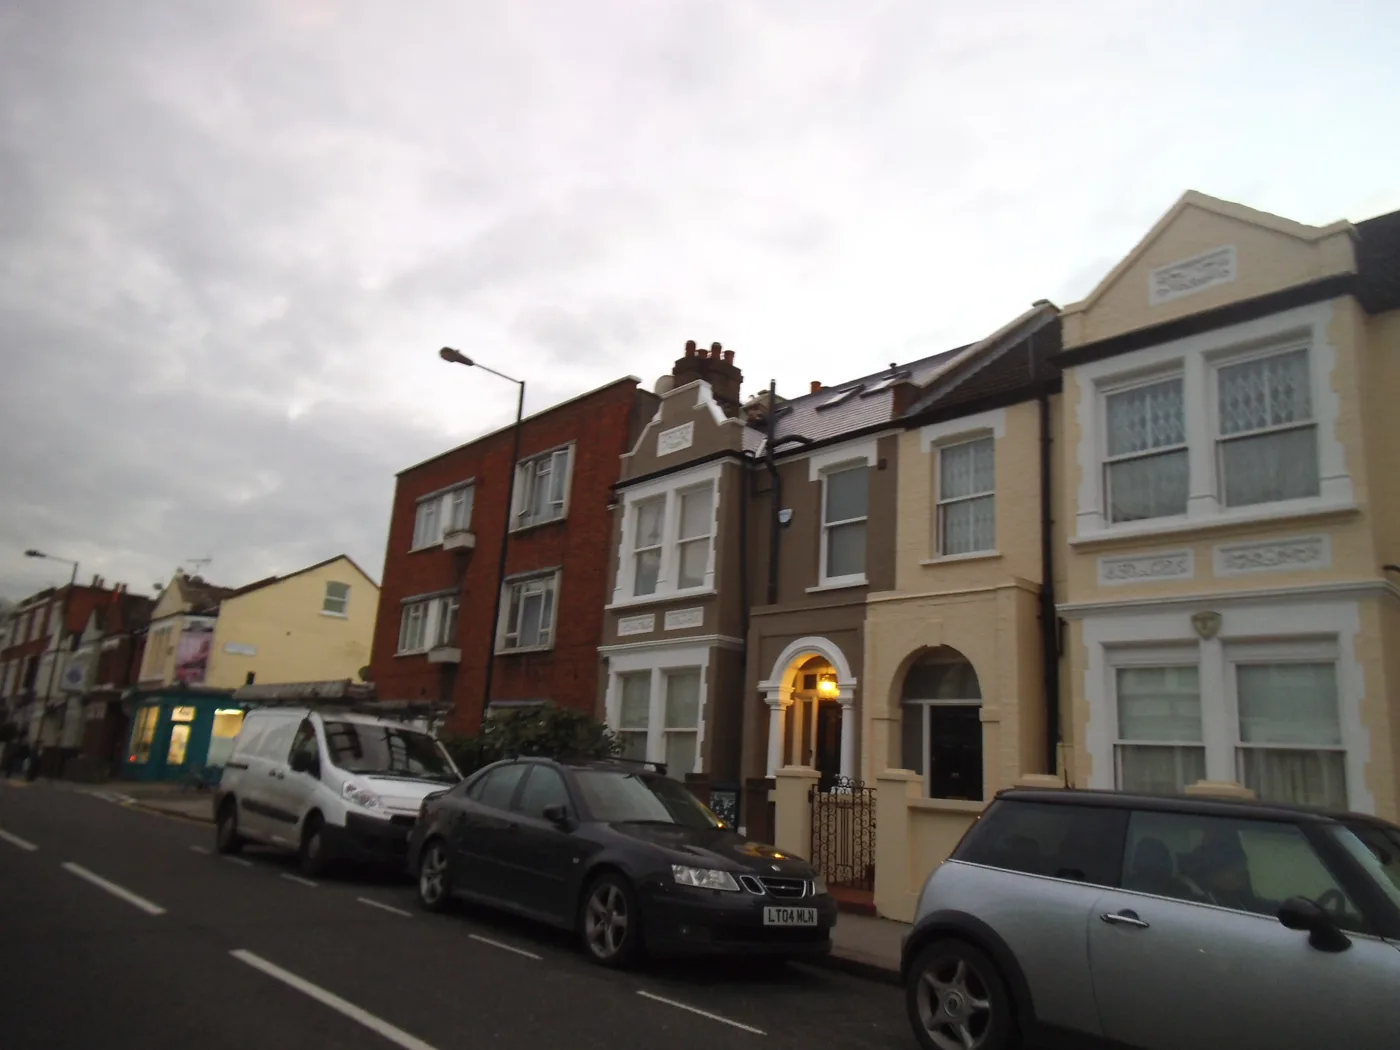

The typical SW6 home sold for £777,500 and the borough median was £675,000, from 1,246 Land Registry sales. Ward medians run £1,181,000 down to £488,750.
Two official records answer different questions about what a home here is worth. The UK House Price Index gives a borough average adjusted for the mix of what sold, which is the right number for tracking the market. HM Land Registry’s Price Paid record gives every completed sale, which is what lets you separate Parsons Green from Addison. This page uses both. No asking prices appear anywhere in it.
What a home here actually sold for
Across the year to June 2026, 1,246 homes sold in Hammersmith and Fulham at a median price of £675,000. That is the middle sale: half went for less, half for more. The mean was far higher at £891,753, pulled up by the terraces off Parsons Green.
Fulham proper is more expensive than the borough. The 528 sales in SW6 had a median of £777,500, against £660,000 in W6 (Hammersmith), £625,000 in W12 (Shepherd’s Bush and White City) and £570,875 in W14 (West Kensington and Olympia). If you searched for a Fulham price and want one number, £777,500 is the honest one.
Those figures come from HM Land Registry’s Price Paid data, filtered to the Hammersmith and Fulham local authority district and to standard market transactions only. Every one of the 1,246 sales was confirmed in-borough, so the W14 addresses that actually sit in Kensington and Chelsea are not in here. Sales registered between 1 August 2025 and 26 June 2026 are included. Registration lags completion by weeks, so the recent months are thin and will fill in: August 2025 has 185 sales on the record, June 2026 only 36.
The spread is wide. A quarter of sales came in under £485,000, and 13.2% went for less than £400,000, nearly all of them flats. At the other end, 25.2% of sales passed £1 million and a tenth passed £1.7 million.
| Property type | Sales | Median price |
|---|---|---|
| Detached | 3 | £2,340,000 |
| Semi-detached | 28 | £2,117,500 |
| Terraced | 301 | £1,370,000 |
| Flat or maisonette | 914 | £580,000 |
That table explains the borough in one go. Flats are 73% of everything that sells here, and at a median of £580,000 they are what holds the overall figure down. Step up to a terraced house and the median more than doubles to £1,370,000. There is no gentle middle rung: the jump from a converted flat to a whole Victorian terrace is roughly £790,000, which is why so many households leave the borough rather than move up within it.
Three detached houses sold in a year, out of more than a thousand sales.
Ward by ward
The borough median hides a range of nearly £700,000 between its priciest and cheapest wards. These medians come from the same Land Registry pull, with every sale’s postcode mapped to its ward through postcodes.io. All 21 wards had at least 15 sales, so none is omitted here.
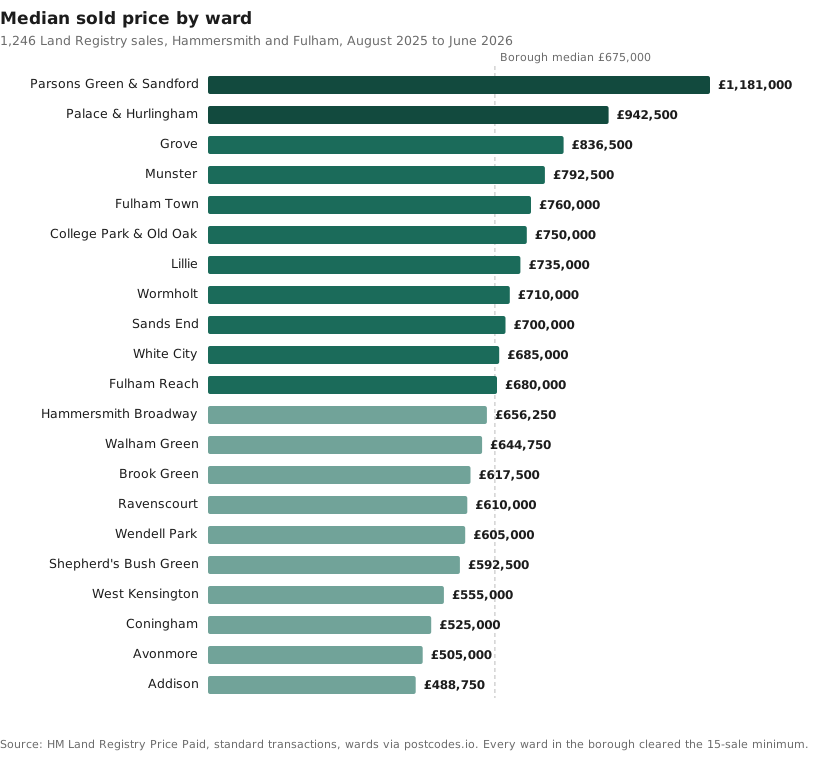
Parsons Green and Sandford (£1,181,000) leads, and it is the one ward where the housing stock is overwhelmingly whole houses rather than converted flats: its terraced median is £2,475,000. Palace and Hurlingham (£942,500) follows, taking in the streets between Bishop’s Park and Hurlingham Park. Then Grove (£836,500), Munster (£792,500) and Fulham Town (£760,000), which is the core of Fulham between the Fulham Road and the river.
At the other end, Addison (£488,750), Avonmore (£505,000) and Coningham (£525,000) sit under £525,000. These are the wards with the most purpose-built flats, and their medians describe a flat market rather than a house market.
A ward median is not a street price, and Ravenscourt proves it better than anywhere in the borough. It has the cheapest flats here, a median of £390,000, and it also recorded the borough’s largest sale of the year: £5,885,000 for a terraced house on St Peter’s Square, W6, in February 2026. One ward, two housing markets, sharing a number that describes neither.
Which way prices are moving
Here the mix-adjusted index is the better guide, and it makes uncomfortable reading for sellers. The UK House Price Index put the average Hammersmith and Fulham home at £729,407 in May 2026, down 10.9% over the year.
| Area | Average price | Annual change |
|---|---|---|
| Hammersmith and Fulham | £729,407 | -10.9% |
| London | £544,814 | -3.7% |
| England | £292,095 | +2.3% |
That is a fall roughly three times London’s, in a year when England as a whole rose. The index also shows it accelerating: the annual change was -3.1% in October 2025, -5.8% in February 2026 and -10.9% by May. A borough this dependent on flats, and on buyers borrowing at London multiples, feels higher interest rates earlier and harder than the national average does. In plain terms, a home worth £818,000 in May 2025 is worth about £729,000 now, so a seller pricing against last year’s comparable is roughly £89,000 adrift.
The two headline figures on this page differ for a reason worth understanding. £729,407 is mix-adjusted, so it answers “what has happened to the value of a typical home here”. £675,000 is the raw middle of what actually changed hands, so it answers “what did people pay”. Both are Land Registry data. They are not in conflict.
What it means for you
If you are buying a first flat, the £580,000 flat median and the £485,000 lower quartile are your real range, and Addison, Avonmore and Coningham, all in W14 and W12, are where that money goes furthest.
If you are trading up to a house, budget for the £790,000 step from flat to terrace. That is the single largest financial decision the borough asks of anyone who lives here.
If you are selling, the market is down 10.9% year on year and the fall is getting steeper, not shallower. Pricing against a neighbour’s sale from two years ago is the most reliable way to sit unsold.
Commuting explains part of the ward spread, though less than you might expect. Every station in the borough is in Zone 2 and every one of them charges the same fare into Zone 1, so what varies is minutes rather than money. The difference in journey times across the borough is priced into the streets around each station, and Shepherd’s Bush reaching Bank in 20 minutes against Putney Bridge’s 36 is the sharpest example.
New building will change some of these wards, and the draft Local Plan puts 25,000 homes into five growth areas, most of them in Fulham and White City.
Frequently asked questions
What is the average house price in Fulham?
The UK House Price Index put the average Hammersmith and Fulham home at £729,407 in May 2026. The median of actual completed sales in SW6, which is Fulham proper, was £777,500 over the year to June 2026, against a borough median of £675,000. The first is mix-adjusted, the others are raw middle sales.
Are Fulham house prices falling?
Yes, and faster than London. Prices were down 10.9% in the year to May 2026, against London’s 3.7% fall, while England as a whole rose 2.3%. The rate of fall has been accelerating since October 2025.
What is the most expensive part of Hammersmith and Fulham?
Parsons Green and Sandford ward, at a median of £1,181,000, ahead of Palace and Hurlingham on £942,500. The single largest sale of the year was £5,885,000 on St Peter’s Square in Ravenscourt ward.
What is the cheapest part of Hammersmith and Fulham?
Addison (£488,750), Avonmore (£505,000) and Coningham (£525,000), the wards with the most purpose-built flats.
How much is a flat in Fulham?
The median flat or maisonette across the borough sold for £580,000 over the year to June 2026. Flats are 73% of all sales here, so that figure describes most of the market.
Where can I check what a specific house sold for?
Every completed sale in England and Wales is public. Look up a street or an address free on the HM Land Registry Price Paid service.
Sources
- HM Land Registry Price Paid data, filtered to the Hammersmith and Fulham local authority district, standard transactions only, sales registered 1 August 2025 to 26 June 2026, for every median, count and percentile on this page.
- postcodes.io for mapping each sale’s postcode to its electoral ward.
- UK House Price Index, Hammersmith and Fulham (HM Land Registry / ONS) for the May 2026 average and annual change, and the London and England comparisons.
- HM Land Registry Price Paid search to check any individual address.
Land Registry figures are revised as more sales register. The most recent months undercount and will rise. Check the linked sources before relying on any figure here for a valuation.
Have your say